Monitoring
Incidents
Status pages
Maintenance
Team members
Integrations & API
N.noc724 team
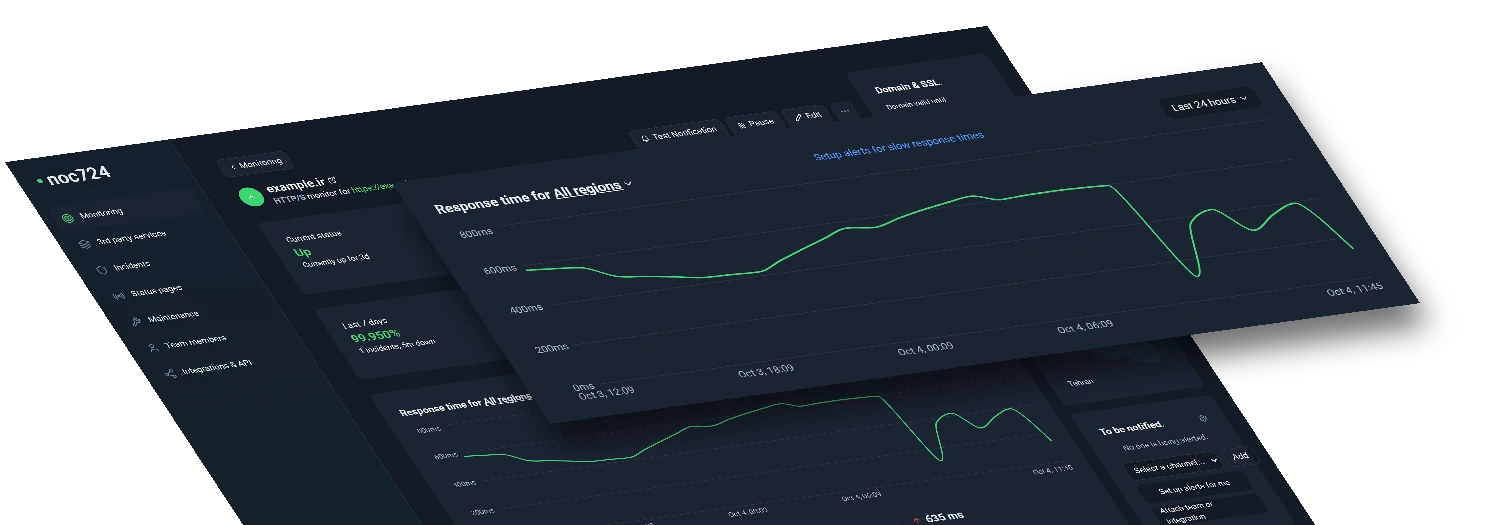
Response time
Last 30 days ⌄1,600 ms
805 ms
10 ms
Apr 25, '23
May 5, '23
May 12, '23
May 19, '23
May 26, '23
≈ 123.15 ms
Average
⤒ 1,597.45 ms
Maximum
NOC724
↻ 5 min
noc724
Slow response time detected!
Enhance performance
with response time
monitoring.
Sit back and get live alerts when your website or service responds slower than usual.
Explore more uptime monitoring features.
Multi-location checks
Check from several cities and see each location's response time on its own.
Recurring notifications
Set repeat intervals so you don't miss a serious outage.
Share incident updates
Keep your visitors informed on your public status page.
Website uptime
Track the uptime of your website and get notified the moment something happens.
Domain and SSL monitoring
Get reminders before your domain registration or SSL certificate expires.
Add team members
Share access with your coworkers, keep them notified and let them manage monitors.
Respond swiftly to degraded performance.
Monitoring
Incidents
Status pages
Maintenance
Team members
Integrations & API
N.noc724 team
Alert notification channels.
SMS
+98 912 000 0000
Telegram
Ops team channel
Bale
On-call group
Webhook
https://hooks.example.com/noc
NOC724
↻ 5 min
noc724
Slow response time detected!
Last 24 hours
99.983%
Prevent potential service disruptions.
Improve user experience.
Monitoring
Incidents
Status pages
Maintenance
Team members
Integrations & API
N.noc724 team
Response time for Mashhad ⌄
Last 30 days ⌄1,600 ms
805 ms
10 ms
Apr 25, '23
May 5, '23
May 12, '23
May 19, '23
May 26, '23
≈ 312 ms
Average
⤒ 1,847 ms
Maximum
Set up response time monitoring
in seconds.
Be the first to know when your website slows down. Reliable monitoring warns you before significant trouble and saves you money.
Know more than
just up or down.
Multi-location checks, response time tracking, SSL and domain expiry alerts. The details that tell you what's really going on.
All you really care about
monitored in one place.
From websites and APIs to servers and cron jobs, noc724 watches every layer. Eight monitor types, one dashboard.
Build trust with
public status pages.
Be transparent. Share your uptime with the public and keep your customers informed about any planned (or unplanned) outages.
noc724
Monitoring
Incidents
Status pages
Maintenance
Team members
Integrations & API
Monitors.
api.core-backend-v2
HTTP · Down for 42m
www.client-eshop.ir
HTTP · Up 14d 2h
db-replica-01 (Port 5432)
PORT · Paused 24d
mx.company-mail.ir
DNS · Paused 1h
Invoice-Generator-Cron
HEARTBEAT · Up 5m 35s
Invite team member
Phone number
We will text the invitation to this number. If there is no noc724 account behind it yet, they will be invited to create one.
Role
Editor ⌄Add your team members
to keep them notified.
Invite your whole team to see your monitors, get alerted and work on incidents together. Choose from four levels of access: admin, editor, viewer and notify-only.
Catch every incident before it reaches your users.
Get notified the instant something breaks: by SMS, Telegram, Bale, Soroush Plus or webhook. Watch your whole stack from one place and pick the channels that reach your team fastest, so critical issues never sit unseen.
Monitors.
api.core-backend-v2
HTTP · Down for 42m
www.client-eshop.ir
HTTP · Up 14d 2h
db-replica-01 (Port 5432)
PORT · Paused 24d
mx.company-mail.ir
DNS · Paused 1h
Invoice-Generator-Cron
HEARTBEAT · Up 5m 35s
NOC724
5 min
noc724
Down monitor detected!
Last 24 hours
95.420%
Frequently asked questions.
Response time monitoring measures how long your website or server takes to answer each check and alerts you when it gets slower than a threshold you set - before slowness turns into downtime.
8
monitor types
15s
fastest checks
Get your FREE account now, 5 monitors included!
Start monitoring for freeNo credit card required!