Monitoring
Incidents
Status pages
Maintenance
Team members
Integrations & API
N.noc724 team
Monitor on Checkout Service API
API monitor for https://api.mystore.ir/v1/checkout/health
Assertions.
Monitor is up if all assertions pass
✓statusCodeequals200
✓$.data.system_statusequalsoperational
✓$.data.payment_gatewayequalsconnected
Ensure API reliability
with proactive
API monitoring.
Stay one step ahead with instant alerts on API downtime, wrong responses or slow responses.
Keep your API-powered services
running smoothly.
Monitoring
Incidents
Status pages
Maintenance
Team members
Integrations & API
N.noc724 team
API monitors 1 Down · 2 Up · 0 Other
Payments API - charge
API · Up 124 d
100%
Object storage - assets
API · Down 6 m
99.957%
SMS gateway - send
API · Up 23 d
99.848%
Prevent cascading failures.
Go beyond "200 OK" with response
checks.
Monitoring
Incidents
Status pages
Maintenance
Team members
Integrations & API
N.noc724 team
Assertions.
Monitor is up if all assertions pass
✓statusCodeequals200
✓$.data.system_statusequalsoperational
✓$.data.payment_gatewayequalsconnected
{"model": "gpt-4o","usage": {"prompt_tokens": 142,"total_tokens": 180},"choices": [{"message": {"content": null},"finish_reason": "stop"}]}
Great for AI APIs and model routers.
Detect and respond to performance
drops.
Monitoring
Incidents
Status pages
Maintenance
Team members
Integrations & API
N.noc724 team
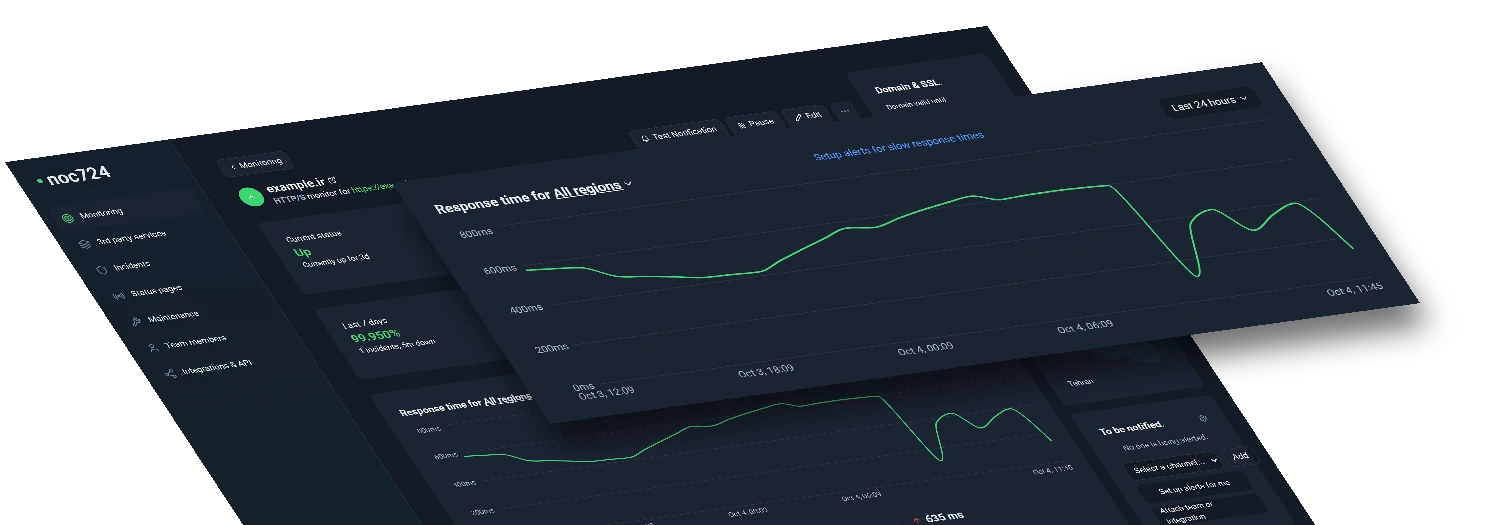
Response time
Last 30 days ⌄1,600 ms
805 ms
10 ms
Apr 25, '23
May 5, '23
May 12, '23
May 19, '23
May 26, '23
≈ 101.66 ms
Average
⤒ 1,546.96 ms
Maximum
Set up API monitoring in
seconds.
Be the first to know when your API breaks. Reliable monitoring warns you before a failing endpoint costs you customers.
Advanced features for advanced users.
Multi-location checks
Choose the regions your monitors check from and catch issues that only show up in some parts of the country.
Recurring notifications
Set a repeat interval so an ongoing outage keeps reminding your team until it's fixed.
Maintenance windows
Set up maintenance windows to pause the monitoring during the maintenance.
Custom HTTP requests
Need to send an advanced HTTP header? We've got you covered!
Know more than
just up or down.
Multi-location checks, response time tracking, SSL and domain expiry alerts. The details that tell you what's really going on.
All you really care about
monitored in one place.
From websites and APIs to servers and cron jobs, noc724 watches every layer. Eight monitor types, one dashboard.
Build trust with
public status pages.
Be transparent. Share your uptime with the public and keep your customers informed about any planned (or unplanned) outages.
noc724
Monitoring
Incidents
Status pages
Maintenance
Team members
Integrations & API
Monitors.
api.core-backend-v2
HTTP · Down for 42m
www.client-eshop.ir
HTTP · Up 14d 2h
db-replica-01 (Port 5432)
PORT · Paused 24d
mx.company-mail.ir
DNS · Paused 1h
Invoice-Generator-Cron
HEARTBEAT · Up 5m 35s
Invite team member
Phone number
We will text the invitation to this number. If there is no noc724 account behind it yet, they will be invited to create one.
Role
Editor ⌄Add your team members
to keep them notified.
Invite your whole team to see your monitors, get alerted and work on incidents together. Choose from four levels of access: admin, editor, viewer and notify-only.
Catch every incident before it reaches your users.
Get notified the instant something breaks: by SMS, Telegram, Bale, Soroush Plus or webhook. Watch your whole stack from one place and pick the channels that reach your team fastest, so critical issues never sit unseen.
Monitors.
api.core-backend-v2
HTTP · Down for 42m
www.client-eshop.ir
HTTP · Up 14d 2h
db-replica-01 (Port 5432)
PORT · Paused 24d
mx.company-mail.ir
DNS · Paused 1h
Invoice-Generator-Cron
HEARTBEAT · Up 5m 35s
NOC724
5 min
noc724
Down monitor detected!
Last 24 hours
95.420%
Frequently asked questions.
API monitoring calls your endpoints on a schedule and checks the answer: the HTTP status code, the response time and values inside the JSON body. When a check fails, noc724 opens an incident and alerts your team.
8
monitor types
15s
fastest checks
Get your free account now, 5 monitors included!
Start monitoring for freeNo credit card required!