Monitoring
Incidents
Status pages
Maintenance
Team members
Integrations & API
N.noc724 team
smtp-relay.company.net (Port 587)
PORT · Up 22 d
99.983%
db-prod-01 (Port 5432)
PORT · Up 6 d 14 h
99.991%
cache-redis-01 (Port 6379)
PORT · Down for 18 m
99.340%
Monitor any specific
port on your server.
Check that the service behind a port is still accepting connections, not just that the server answers a ping. Watch your mail, database, SSH and FTP ports every few seconds.
Monitor any port on your server.
Monitoring
Incidents
Status pages
Maintenance
Team members
Integrations & API
N.noc724 team
smtp-relay.company.net (Port 587)
PORT · Up 22 d
99.983%
cache-redis-01 (Port 6379)
PORT · Down for 18 m
99.340%
db-prod-01 (Port 5432)
PORT · Up 6 d 14 h
99.991%
Last 7 days
100%
0 incidents, 0 m down
Jan 23
99.999%
1 inc., 1 m, 32 s
Make sure your email service runs smoothly.
Port monitoring for your DNS server.
Monitoring
Incidents
Status pages
Maintenance
Team members
Integrations & API
N.noc724 team
Root cause
DNS Port 53 not answering
Activity log.
Alert notification channels.
SMS
+98 912 000 0000
Telegram
Ops team channel
Bale
On-call group
Webhook
https://hooks.example.com/noc
Soroush Plus
NOC bot
Choose your preferred type
of notifications.
Easy setup: 3 clicks to create
a port monitor.
Be the first to know when a service stops accepting connections. Reliable monitoring warns you before small troubles become outages.
Advanced features for advanced users.
Multi-location checks
Choose the regions your monitors check from and catch issues that only show up in some parts of the country.
Recurring notifications
Set a repeat interval so an ongoing outage keeps reminding your team until it's fixed.
Maintenance windows
Set up maintenance windows to pause the monitoring during the maintenance.
Custom HTTP requests
Need to send an advanced HTTP header? We've got you covered!
Know more than
just up or down.
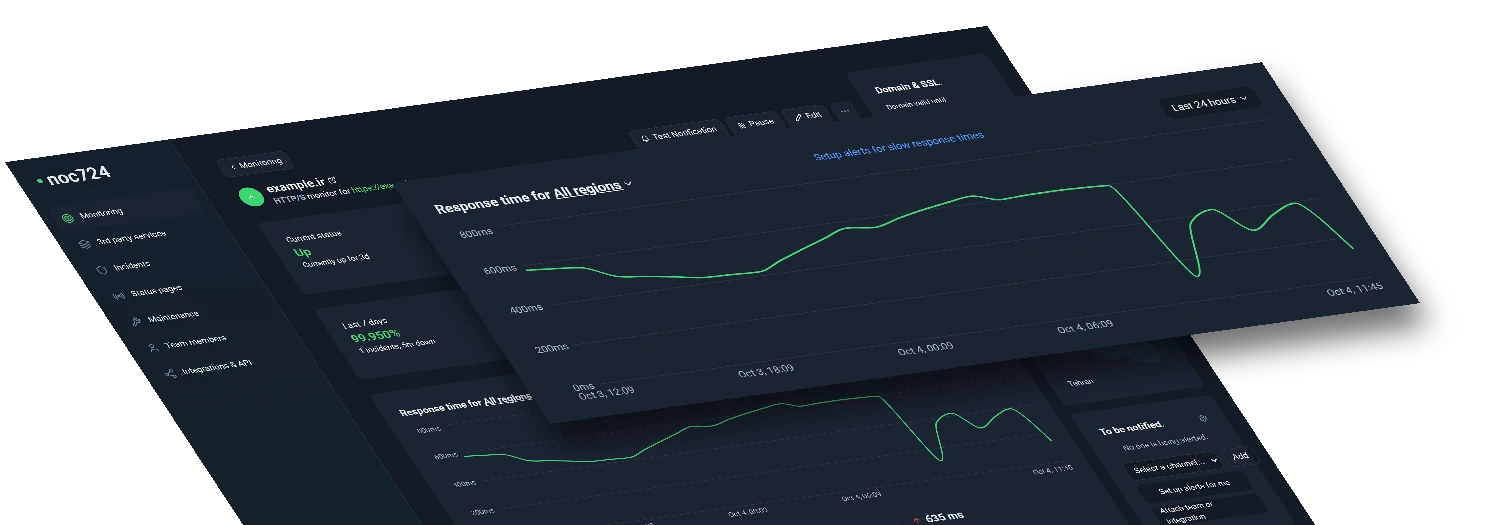
Multi-location checks, response time tracking, SSL and domain expiry alerts. The details that tell you what's really going on.
All you really care about
monitored in one place.
From websites and APIs to servers and cron jobs, noc724 watches every layer. Eight monitor types, one dashboard.
Build trust with
public status pages.
Be transparent. Share your uptime with the public and keep your customers informed about any planned (or unplanned) outages.
noc724
Monitoring
Incidents
Status pages
Maintenance
Team members
Integrations & API
Monitors.
api.core-backend-v2
HTTP · Down for 42m
www.client-eshop.ir
HTTP · Up 14d 2h
db-replica-01 (Port 5432)
PORT · Paused 24d
mx.company-mail.ir
DNS · Paused 1h
Invoice-Generator-Cron
HEARTBEAT · Up 5m 35s
Invite team member
Phone number
We will text the invitation to this number. If there is no noc724 account behind it yet, they will be invited to create one.
Role
Editor ⌄Add your team members
to keep them notified.
Invite your whole team to see your monitors, get alerted and work on incidents together. Choose from four levels of access: admin, editor, viewer and notify-only.
Catch every incident before it reaches your users.
Get notified the instant something breaks: by SMS, Telegram, Bale, Soroush Plus or webhook. Watch your whole stack from one place and pick the channels that reach your team fastest, so critical issues never sit unseen.
Monitors.
api.core-backend-v2
HTTP · Down for 42m
www.client-eshop.ir
HTTP · Up 14d 2h
db-replica-01 (Port 5432)
PORT · Paused 24d
mx.company-mail.ir
DNS · Paused 1h
Invoice-Generator-Cron
HEARTBEAT · Up 5m 35s
NOC724
5 min
noc724
Down monitor detected!
Last 24 hours
95.420%
Get inspired by
the use cases.
Improved network security by keeping an eye on open ports
Tracking status and performance of network devices
Faster troubleshooting and shorter incident response time
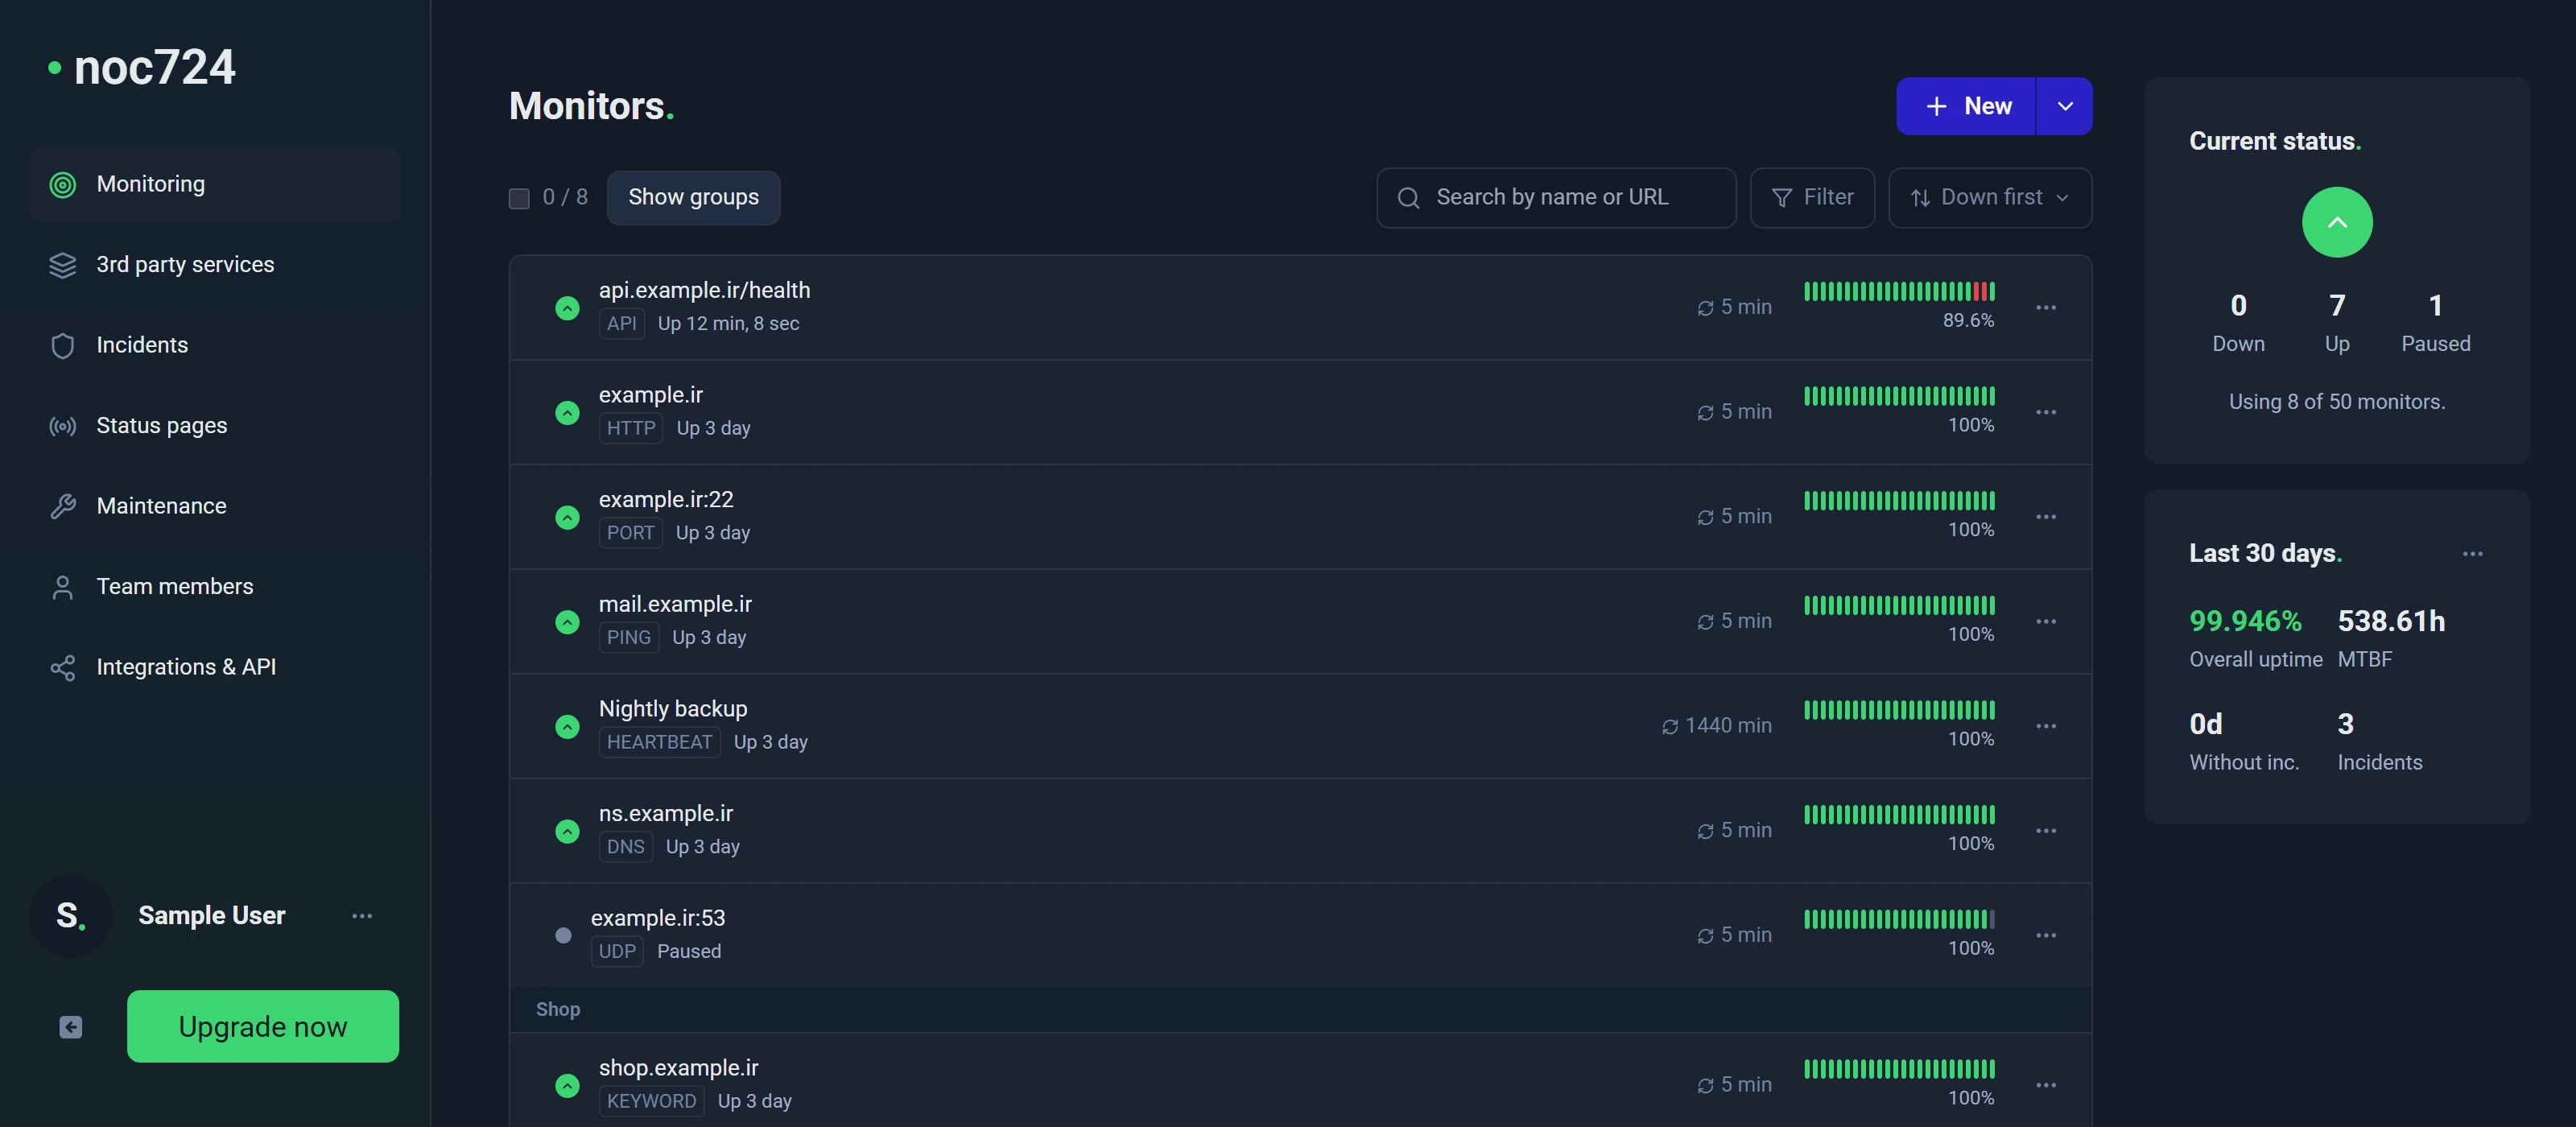
When a port stops answering, noc724 opens an incident and tells your team within seconds.
Every check, failure and alert lands in the incident timeline, so you can see exactly when a service went away and when it came back.
Frequently asked questions.
Port monitoring checks that a service on your server accepts TCP connections on its port, for example SMTP on 25/587, SSH on 22 or PostgreSQL on 5432. It confirms the service itself is listening, not just that the machine answers pings.
8
monitor types
15s
fastest checks
Get your FREE account now, 5 monitors included!
Start monitoring for freeNo credit card required!